Building a better algorithm to predict flood risk in the age of climate change

It’s dusk in Charleston, South Carolina, and Sharai Lewis-Gruss slides on waders and sloshes into a deep puddle on the side of the road.
“Let’s move in,” she yells.
She’s a cartographer, usually in front of her computer. But tonight, she uses a yardstick and a tablet for her work: improving flood maps. To her left, marsh grass and the sea, and to her right, the city’s stately colonial mansions.
“It feels really squishy at the bottom over here … must be some sediment is being pushed up from the water,” Lewis-Gruss suggesed.
Lewis-Gruss flew in from New York just to measure these puddles, because she knew there would be a king tide that night — one of the highest tides of the year. The whole bay is rising while water fills the neighborhood.
“So in this spot, sticking my ruler in right next to the storm drain opening and it’s already at 11 centimeters,” she said.

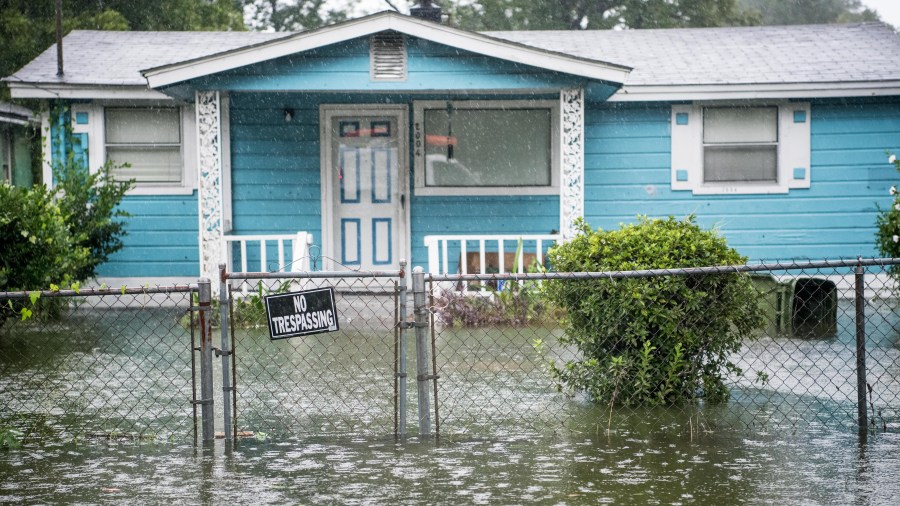
The water rises through the evening, up from 4 inches to 3 feet in some spots. Small fish swim through the street while some neighbors keep watch from their porches and Lewis-Gruss moves from block to block, entering data.
“It feels shocking to me to see streets completely inundated with water on a day when there’s no rain and no major tidal surge from a hurricane,” Lewis-Gruss said. “It’s just your everyday high-tide flooding.”
Flooding that’s growing worse because of sea level rise. Lewis-Gruss works for First Street Foundation, which is on a mission to update flood maps with the real flood risk of every home in America. It merges federal flood data with local zoning maps and high-tech lidar images.
Lewis-Gruss ran a computer model that predicted this flooding, and unfortunately, that night, her predictions were right.
“It’s a good feeling for us, but it really makes me sad for places like this that have to experience this type of flooding so frequently,” she said.
“Can I talk to you for a sec?” said Kristina McClure, who’s a local jewelry maker.
McClure feels nervous, frustrated and surprised as she stands in her yard watching the water rise. She and her husband saved throughout the years for a cute, little, white cottage.
“I knew Charleston flooded a little bit, but not like this,” McClure said.
Now she’s saving, again. This time, to lift the house 6 feet off the ground. But it hasn’t been easy to figure out whether to make this investment or if it will even be enough to protect them from future floods.
“It’s hard to tease out what’s really going on,” she added. “That’s what’s frustrating.”
It’s hard to know what’s an anomaly and what’s normal now. The Federal Emergency Management Agency tracks flooding and dictates who needs flood insurance. But FEMA’s official flood maps aren’t cutting it. They use backward-looking data instead of future projections.
“What’s the risk going to be in 10, 20, 50 years down the road? And the maps don’t tell you that at all,” said Carolyn Kousky, the director of the Risk Management and Decision Processes Center at Wharton University.
The maps don’t factor in climate change, nor do they include millions of homes that have never been mapped for flood risk. That’s a problem for homeowners.
“What they see in their communities might be different from what’s on the map,” Kousky said. “And what I hear a lot of is actually distrust of the maps from FEMA.”
FEMA updates its maps every three or five years. A federal advisory council has pushed FEMA to map more frequently and take climate change into account. FEMA officials say they’re making their data more open, and they welcome projects like First Street.

Meanwhile, more companies and nonprofits are picking up the slack. First Street works with several universities, and it has a new tool called Flood IQ, where people on the East Coast and Gulf Coast can look up their property. Homeowners like the McClures in Charleston can see their risk under different scenarios, from a Category 3 hurricane to the highest tide of the year.
That’s why Lewis-Gruss goes out there in waders to make the tool as good as it can be.
“Until every person can fully understand their past, present and future risk to flooding, they will continue to be hurt by flood events,” Lewis-Gruss said.
But FEMA maps are the law of the land. Even though they’re not the best predictor of future flooding, they determine official flood zones, who gets flood insurance and who can build what and were.
The future of this podcast starts with you.
Every day, the “Marketplace Tech” team demystifies the digital economy with stories that explore more than just Big Tech. We’re committed to covering topics that matter to you and the world around us, diving deep into how technology intersects with climate change, inequity, and disinformation.
As part of a nonprofit newsroom, we’re counting on listeners like you to keep this public service paywall-free and available to all.
Support “Marketplace Tech” in any amount today and become a partner in our mission.


