
How satellite radar helps scientists map the destruction in Gaza
The World Court is expected to rule Friday on whether to grant emergency measures to stop the war in Gaza. South Africa has accused Israel of carrying out genocide in the Palestinian enclave.
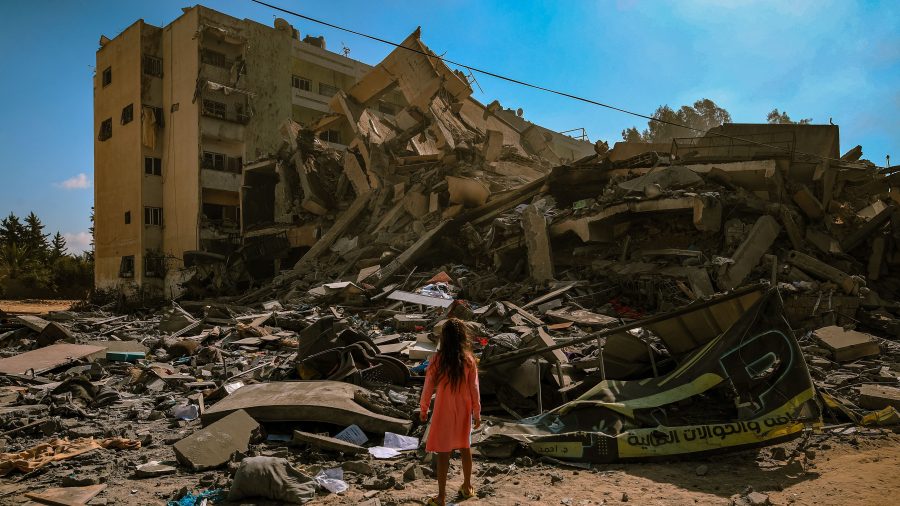
Israel says it’s targeting Hamas militants — not civilians — in response to the deadly Hamas attack of Oct. 7. But more than 25,000 Palestinians have been killed in the Israeli military offensive.
Nearly half the buildings in Gaza have been damaged or destroyed, according to Corey Scher, an environmental sciences graduate student at City University of New York, and Jamon Van Den Hoek, associate professor of geography at Oregon State University.
Marketplace’s Lily Jamali spoke to Scher and Van Den Hoek about their work mapping the destruction with satellite radar technology.
The following is an edited transcript of their conversation.
Corey Scher: What satellite radar does is it illuminates a region with microwaves, radar waves, similar to a camera flash, but from 700 kilometers in altitude. And it does this from an angle. So, because we know the characteristics of the outgoing wavelengths, when the satellite retrieves the echoes of those microwaves back at its sensor, we get an idea of the 3D structure and arrangement of a region, which is much different than looking at the color of a region.
Lily Jamali: So, coming at this from an angle, it sounds like, gives you a much more textured understanding of what is happening in the way of destruction.
Scher: “Texture” is a great way to phrase it. In this specific research community, we often talk about the structure and arrangement of a region, its randomness. But yeah, we are more sensitive to the texture of a region with satellite radar.
Jamali: You started working on mapping Gaza well before the current conflict. When did your focus on Gaza begin?
Jamon Van Den Hoek: Corey and I have been working on Gaza since the 2021 conflict. But separately, we have been working in Gaza before that and sort of in between. I first started studying the landscape changes in Gaza in 2015, following the 2014 conflict. And there, I think the real concern behind trying to understand the motivation to try to look at the Gaza Strip and what’s happening in Gaza Strip, as well as West Bank, is the difficulties of access, difficulties of actually understanding the scale and the scope of humanitarian challenges associated with the long-standing geopolitical isolation, marginalization, economic deprivation, that Palestinians have endured. It’s quite a unique geography, in that if you’re born in Gaza, it’s very difficult to leave Gaza. That means there’s a restriction on awareness of what’s happening on the ground in these conflicts. There’s a kind of unique challenge in trying to document this type of damage from the ground, which we’re seeing here in this current conflict with such a large loss of life with journalists and humanitarian responders. It’s always been challenging, but this is especially acute. Gaza and West Bank have presented unique challenges and just a kind of invisibility and a lack of awareness of what is actually happening not just to the built environment, which is what we can see better than anything with the approach we’re taking now, but really what’s happening to families, to households, to livelihoods, communities, economies. These are really the end result. The human toll is really what’s of concern here. And we can get at some of those proxies and address some of those invisibilities through remote sensing by looking at damage to cities, damage to schools, types of infrastructure, agricultural change, etc.
Jamali: Corey, can you talk about where this information has landed? I’m seeing it being used in a lot of journalism outlets. Do you think there’s a place for this data that you all have collected and then visualized among lawmakers who are calling for a ceasefire? Or in the genocide case that South Africa has brought against Israel at the International Court of Justice?
Scher: When you mentioned the South Africa complaint to the ICJ, there were a few citations to our damage assessments within that complaint, mainly from a BBC piece when that, when the estimate of potential damage exceeded 100,000 buildings in Gaza. That piece was cited a couple of times throughout that complaint. Your question about lawmakers gets to a point that I care a lot about, and it’s that as a physically based indicator, it is some of the only information that one can get out of the region that’s not aligned with one political actor or another. We can look at it from space and see how its morphology or its structure is changing. And those approximations of what’s happening on the ground, we’ve seen different political actors attach different narratives to them. Our maps have been ingested both on Israeli national television networks and also networks like Al Jazeera, or groups with ostensibly different ways of looking at things, but I think just as physically based indicators that are not aligned and that can be transparent and reproducible in a scientific sense. Because of open data and scientific methods, it’s a unique way of being able to map what’s playing out on the ground.
Jamali: These are facts in a conflict where getting facts has been especially challenging. There are a lot of journalists from the outside and journalists inside of the Gaza Strip who are trying to get this information out have put themselves at tremendous risk to do that.
Van Den Hoek: I’d say any accounts that we have from journalists or humanitarians or civilians on the ground, it may be an accurate assessment, it may be a precise location, but it just becomes a single data point amongst really a sea of events. The approach that we’re taking allows for a systematic Gaza Strip-wide assessment, where we’re applying the same methodology site after site, day after day. That gives a kind of systematic awareness and consistency. I don’t think that we would call these facts, it’s certainly not an objective assessment. There are lots of decisions made, it’s not a clear end point. From getting raw synthetic-aperture radar data to generating damage maps.
So, there’s a lot of decisions, there’s parameterization made throughout the whole process. But it is our best assessment, and it’s a very restrictive assessment of what we’re trying to see. We do our best to remove suggestions of sites of likely damage that we think are incorrect or that we think are effectively giving us a false indication or a false positive and inflating the damage assessment. So, we really do our best to remove all those sources that cause this artificial inflation of the data, which are many. And the result that we get ends up being a kind of pattern, a kind of tempo of likely damage on the landscape that, that aligns well with what we’re seeing. Certainly, the overall big picture certainly confirms and lines up with other accounts of the sheer scale and speed of the war. But we’re also seeing week after week after week quite a good agreement. And in the reports that have been put up by the U.N., we see very good agreement with their work, which is done through a totally different system. So, we have a good degree of confidence there.
Jamali: Has anybody disputed the data that you’re putting out there?
Van Den Hoek: Sure, lots of people have disputed it with no evidence. There’s a lot of people, including random commentators, who have said this is wrong, this is impossibly high. That hasn’t been happening lately, but early on, there were people that contested the statistics. And they were, of course, simultaneously voicing their support for military operations. So, it was a little perplexing to us to see people discounting the scale of damage when that’s exactly what they wanted to see.
Scher: What’s novel about this work is that within war zones, journalists and humanitarian actors are some of the first to have real reports and data on the ground about what’s actually happening. So as scientists, what we always need in this type of work is what we call ground truth data. Where we can be assured that something is in fact happening and we’re seeing it expressed in the signals we’re retrieving from satellite in this way. In that sense, when we hand off these data to different journalism desks, they are doing their own sense of validation exercises with the reports or the ancillary points of information that they have.
In December, the Israeli military campaign in Gaza was deemed among the deadliest and most destructive in recent history. The scope of destruction has exceeded the razing of Aleppo, Syria, between 2012 and 2016, the siege of Mariupol in the early days of Russia’s invasion of Ukraine, and in some ways the bombing of Germany by Allied forces in World War II.
The evidence shows that the vast majority of bombs dropped on Gaza were made in the United States.
The future of this podcast starts with you.
Every day, the “Marketplace Tech” team demystifies the digital economy with stories that explore more than just Big Tech. We’re committed to covering topics that matter to you and the world around us, diving deep into how technology intersects with climate change, inequity, and disinformation.
As part of a nonprofit newsroom, we’re counting on listeners like you to keep this public service paywall-free and available to all.
Support “Marketplace Tech” in any amount today and become a partner in our mission.


